Global shipping turns packaging into a performance decision, not merely a purchasing task. A carton may face rain in Singapore, vibration at sea, and repeated handling in Rotterdam. Impact packaging solutions must protect products while controlling weight, volume, damage, and environmental burden.
The OECD Global Plastics Outlook reports that global plastic waste reached 353 million tonnes in 2019. Packaging represented about 40% of that total, while only 9% was recycled. These figures expose a difficult trade-off. Less material can reduce emissions, but insufficient protection may increase product damage and replacement shipments. The World Bank’s What a Waste 2.0 report also estimated 2.01 billion tonnes of municipal solid waste annually. Packaging choices clearly sit inside a wider waste system.
Ellen MacArthur, a leading circular-economy authority, states: “A circular economy is based on the principles of designing out waste and pollution, keeping products and materials in use, and regenerating natural systems.” Her principle supports packaging designed for reuse, recovery, or safer material separation.
Yet no universal package wins everywhere. A molded-pulp insert may perform well in a dry warehouse, then weaken during ocean transit. A lightweight design may look efficient, but fail a drop test. Regional recycling access also changes the real outcome. Data definitions vary, and some supplier claims remain difficult to verify. This guide examines material selection, ISTA testing, dimensional efficiency, climate exposure, and end-of-life practicality. The strongest decision combines laboratory evidence with experience from actual shipping lanes. Sometimes, the most sustainable package is the one that prevents one expensive failure.
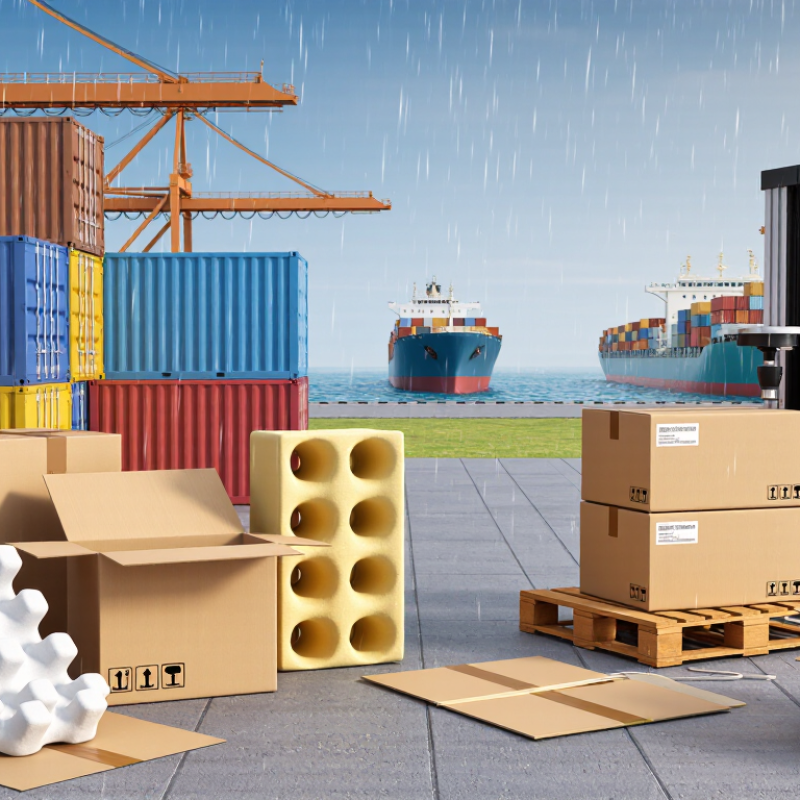
More than 80% of global merchandise trade by volume moves by sea, according to UNCTAD’s Review of Maritime Transport 2023. That figure changes how packaging risks should be assessed. A product may face port handling, container vibration, salt air, humidity, and long storage delays. Route analysis should begin with product fragility, mass, dimensions, and closure strength. Then map each transfer point.
Small details matter. A glass component needs internal restraint, not only thicker outer walls. Moisture-sensitive goods may require barrier films, desiccants, and humidity indicators. Heavy loads need compression testing and stable pallet patterns. The World Bank’s Logistics Performance Index 2023 shows major differences in logistics quality across countries. Therefore, packaging should not rely on one ideal handling environment.
Test the complete pack, not just its materials. Use recognized procedures such as ASTM D4169 or ISTA distribution testing, then adapt them to the actual sea route. Include drop, vibration, compression, and climatic conditioning. UNCTAD data highlights the scale of maritime exposure, but it cannot describe every port or vessel. No test plan is perfect. A practical weakness is often overlooked: teams may test new packaging once, then ignore seasonal humidity or supplier changes. Record failures, inspect damaged corners, and revise the design using measured evidence. Bayesian? No. Simple evidence works better.
How to Choose Impact Packaging Solutions for Global Shipping?
Fragility data should guide the test plan, not merely decorate a report. Record the product’s mass, center of gravity, weak points, and allowable damage limits. Shock data from sensors can reveal whether a corner drop or repeated vibration creates the greatest risk. Product history also matters. A failed shipment may expose a packaging weakness that laboratory assumptions miss.
For parcel shipments, map realistic handling hazards into an ISTA 3A test sequence. Include drops, random vibration, and compression based on the shipping profile. A heavier carton may require different drop heights and handling conditions than a small parcel. Do not copy a previous plan without checking package size, weight, and closure design. Small changes can alter the failure pattern.
ASTM D4169 helps create a distribution cycle for broader transport conditions. Select assurance levels and test sequences using actual routes, vehicle types, climate exposure, and stacking time. A qualified laboratory should confirm equipment settings and document every deviation. The first plan is rarely perfect. Review damage evidence after testing, then revise the cushioning, corner protection, or internal restraint. Test results are useful only when they reflect real handling. Sometimes, the most expensive-looking solution protects the wrong surface. That mistake deserves attention.
Choosing impact packaging for global shipping starts with the product’s actual hazards, not a standard box size. Record drop height, package weight, handling direction, and fragile contact points. Cushioning should absorb shock without allowing the product to move. Foam, molded fiber, and corrugated structures behave differently under compression. Corner protection often matters more than adding material everywhere. Small gaps matter.
Vibration requires a different response. A package can survive one drop and still fail after hours of truck, rail, or aircraft movement. Use restraints that prevent repeated contact between the product and its inner pack. Test for resonance when possible, especially with glass, electronics, or long components. Excessive cushioning can create instability. That detail is easy to miss. I have seen designs that looked strong during inspection but loosened after extended vibration.
Moisture control depends on the shipping route and storage conditions. Select a vapor barrier when condensation, sea air, or tropical humidity is likely. Seal every joint continuously, then inspect corners and closures for tiny channels. Add desiccant only after estimating the package volume, product moisture load, and transit duration. A barrier without a reliable seal offers false confidence. Testing should combine shock, vibration, compression, and humidity exposure in a sequence resembling real distribution. No laboratory perfectly predicts every route, so review damage records after each shipment and revise the weak point rather than simply adding more packaging.
How to Choose Impact Packaging Solutions for Global Shipping?
Reduce Material Footprint Against OECD’s 353 Mt of Plastic Waste (2019)
Global shipping makes packaging a material decision, not merely a design choice. The OECD recorded 353 million tonnes of plastic waste in 2019. That figure gives procurement teams a serious baseline. It also needs context. The total covers varied products, regions, and waste systems. A shipping package should reduce material use without shifting damage elsewhere.
Start by measuring grams of packaging per delivered unit. Record empty space, breakage, return rates, and transport distance. A 2-kilogram ceramic part may need edge protection, but not a box twice its size. Right-sizing can reduce plastic film, void fill, and dimensional weight. Test compression, vibration, drops, humidity, and temperature changes. Use recycled content where performance and supply are verified. Select materials that local recovery facilities can actually process. A compostable label means little without suitable collection.
Design reviews should compare total impact, not material weight alone. A thin pouch that fails can create replacements, extra freight, and customer waste. Pilot shipments reveal problems that laboratory tests miss. Inspect crushed corners and loose inserts after real routes. Keep a damage log. Perfect reduction is unlikely. Even experienced teams may overprotect fragile goods or trust unclear recycling claims. Recheck the design quarterly as carriers, destinations, and material availability change.
| Packaging Solution | Typical Primary Material | Typical Material Density (g/cm³) |
Protection Profile | Material Footprint Opportunity | Global Shipping Suitability | End-of-Life Pathway | Key Selection Consideration |
|---|---|---|---|---|---|---|---|
| Corrugated Fiberboard Mailer or Box | Paper-based corrugated board | Approx. 0.40–0.70 | Good compression and abrasion protection; cushioning may be required for fragile goods. | High potential for right-sizing, lightweight design, recycled fiber content, and elimination of unnecessary plastic layers. | High Suitable for parcel, pallet, and container shipping when kept dry. |
Widely recyclable where clean and dry fiber collection exists; remove excessive tape and non-fiber components where required. | Use the smallest box that maintains required edge-crush and compression performance. |
| Molded Fiber Protective Insert | Recovered paper fiber or agricultural fiber | Approx. 0.30–0.60 | Good fit protection and moderate shock absorption for products with defined geometries. | Can replace expanded plastic cushioning and reduce the number of separate protective components. | High Effective for standardized products and multi-unit shipments. |
Generally compatible with paper recycling when free from problematic coatings, adhesives, and contamination. | Validate drop, vibration, compression, and humidity performance before international deployment. |
| Paper-Based Cushioning | Creped, honeycomb, or crumpled paper | Approx. 0.20–0.70 | Good void fill and surface protection; lower shock performance than engineered foam for heavy or highly fragile items. | Can replace loose plastic void fill and is often compatible with fiber-based packaging systems. | High Practical for e-commerce parcels and mixed-SKU shipments. |
Commonly recyclable with paper streams when clean and dry; local collection rules apply. | Control the amount used to avoid overpacking and increased dimensional weight. |
| Reusable Textile or Polymer Tote | Woven textile or durable polymer fabric | Material-specific | Good abrasion and handling protection; cushioning depends on the internal structure. | Most effective when returned and reused enough times to offset production and reverse-logistics impacts. | Medium Best for closed-loop or predictable return networks. |
Reuse is preferred; recycling may require dedicated collection because mixed fibers and coatings can be difficult to process. | Measure return rate, cleaning requirements, loss rate, and average number of reuse cycles. |
| Low-Density Polyethylene Film or Mailer | LDPE plastic film | Approx. 0.91–0.94 | Good moisture and dust barrier; limited puncture and compression protection without reinforcement. | Can be lightweight and material-efficient for soft, non-fragile goods, but plastic reduction and collection access must be assessed. | Medium Useful where moisture resistance is essential and film collection is available. |
Often requires dedicated film collection; contamination and multilayer construction can prevent recycling. | Avoid unnecessary multilayer laminates, permanent labels, and incompatible attachments. |
| High-Density Polyethylene Protective Container | HDPE plastic | Approx. 0.94–0.97 | Good impact, moisture, and chemical resistance; suitable for demanding handling environments. | Reusable formats may reduce single-use material demand when utilization and return logistics are high. | Medium Appropriate for repeated distribution cycles or harsh environments. |
Rigid HDPE is recyclable in many systems, subject to local acceptance, color, additives, and contamination. | Prioritize a durable, mono-material design and document expected reuse cycles. |
| Expanded Polystyrene Cushioning | Expanded polystyrene foam | Approx. 0.010–0.040 | Very good lightweight cushioning and thermal insulation. | Low density can reduce transport mass, but bulky volume and limited collection can create end-of-life challenges. | Low to Medium Use only when performance cannot reasonably be achieved with a more recoverable option. |
Recycling access is highly location-dependent; loose foam is often excluded from household collection. | Confirm destination-country collection options and avoid unnecessary molded or loose foam components. |
| Aluminum Protective Case or Component | Aluminum sheet or formed aluminum | Approx. 2.70 | Very high impact, moisture, and fire resistance; suitable for high-value or sensitive equipment. | Reusable systems can justify higher initial material use when they remain in service for many cycles. | Medium Best for specialized, high-value, or returnable shipping programs. |
Aluminum is widely recyclable as a material, subject to collection and product construction. | Compare the higher initial material mass with documented service life and reuse frequency. |
| Decision rule: select the lightest and smallest solution that passes the required distribution tests, uses compatible materials, and has a credible reuse or recycling route in the destination market. | |||||||
How to Choose Impact Packaging Solutions for Global Shipping?
Packaging decisions should begin with measured damage rates, not attractive materials. The 2024 Global Parcel Shipping Index recorded 161.8 billion parcels worldwide in 2023. Even a small failure rate can create serious costs at that scale. Track damaged units per 1,000 shipments by route, product type, carrier handoff, and season. Then compare field results with ISTA 3A laboratory testing. A package surviving the test may still fail in rain, congestion, or rough manual handling.
Cube utilization deserves equal attention. Measure product volume against the packed carton volume. A 12,000 cm³ product inside a 24,000 cm³ carton achieves only 50% cube utilization. That unused space increases freight exposure and may require more protective fill. Use the same product mix when comparing designs. Otherwise, the numbers mislead. I have seen “lighter” packaging raise damage claims because internal movement increased.
Calculate cost per shipment beyond the purchase price. Include packaging, labor, dimensional freight, returns, disposal, and claims. The 2024 Retail Returns Report estimated that U.S. consumers returned $743 billion in merchandise during 2023, equal to 14.5% of retail sales. Returns are not all packaging failures, but they reveal the scale of avoidable reverse logistics. A practical comparison might show one carton costing $1.10, while a stronger design costs $1.42 but reduces damage from 2.8% to 1.1%. The result still needs validation across markets. One successful pilot is not proof.
Benchmark comparison of anonymous packaging formats using damage rate, cube utilization, and average cost per shipment. Lower damage and cost are preferred, while higher cube utilization indicates more efficient use of transport space.
Damage rate is measured as the percentage of shipments reported with product damage. Cube utilization represents the percentage of available carton volume used by the packed product. Cost per shipment includes packaging materials and estimated handling impact.